AI visibility score: how it's calculated, what's good, and how to build your own
An AI visibility score is a single number, usually 0 to 100, that estimates how often and how prominently AI assistants like ChatGPT, Perplexity and Google's AI features mention your brand across a fixed set of prompts. No AI platform publishes an official score. Every tool builds its own, and the formulas differ enough to change who looks like the winner. This guide shows how the main formulas work, runs one dataset through three of them, and gives you a way to build a score you can defend.
- An AI visibility score is a vendor-built metric, not an official number from ChatGPT or Google.
- Most scores combine mention rate (how often you appear) with position (how high you appear), but each tool weights position differently.
- In our worked example, one set of 100 answers produced scores of 24.7, 48.5 and 14.0 for the same brand, and the formula decided which of two brands was ahead.
- There is no universal good score. Compare against your own trend and your closest competitor, measured the same way.
- Mention rate across enough runs is the most stable part of any score; report it next to whatever composite your tool shows.
What an AI visibility score is
An AI visibility score compresses a lot of AI answers into one number. A tool sends a fixed set of prompts to one or more assistants, such as ChatGPT, Perplexity, Gemini or Google's AI Overviews and AI Mode. It records whether your brand is named in each answer and, usually, where it appears. Then it rolls those observations up into a score, most often on a 0 to 100 scale.
Two things are worth saying up front. First, no AI platform publishes this number. OpenAI, Google and Perplexity don't give brands a visibility score, so every score you see is a third party's estimate built from sampled answers. Second, "AI visibility score" is not one metric. It's a family of metrics that share a name. That matters the moment someone puts a score in a board deck.
Search interest is real and mostly question-shaped. In Ahrefs Keywords Explorer this morning, "ai visibility score" showed about 800 US searches a month. Related questions included "what is the ai visibility score" (about 250), "what is a good ai visibility score" (about 90) and "how is an ai visibility score calculated?" (about 40). People have seen a score in a tool and want to know what it means. That's what this guide answers.
If you're new to the wider topic, our explainer on what AI visibility is covers the basics. Here we stay on the number itself.
The building blocks inside most scores
Under the branding, most scores are built from the same few observations per answer:
| Building block | What it records | How stable it is |
|---|---|---|
| Mention (detection) | Whether your brand is named in the answer at all | The most stable signal when averaged over many runs |
| Position | Where you appear in a list-style answer (1st, 2nd, 3rd…) | Noisy; lists reshuffle from run to run |
| Citation | Whether one of your pages is linked as a source | Depends on the model; some cite many sources, some few |
| Sentiment | Whether the mention is positive, neutral or negative | Needs classification, so it adds its own error |
| Competitor set | Which rivals appear alongside you | Changes the score whenever the tracked set changes |
The mention rate on its own is simple: answers that mention you divided by total answers. Most tools then adjust it for position, because being named first in a shortlist is worth more than being named seventh. How much more is where the formulas split.
Position deserves caution. SparkToro's study of 2,961 responses from ChatGPT, Claude and Google's AI features found that the same list of brands almost never repeated across runs, and the same order repeated even less. The author concluded that visibility percentage across many runs has some statistical validity, while single "AI ranking positions" do not. Keep that in mind as you read the formulas below: they all lean on position to some degree.
How four tools calculate it
We read the methodology pages of the tools that publish one. Here is what each says, in its own terms.
Keyword.com: detection rate × rank score
Keyword.com multiplies two parts. Detection rate is the share of runs in which your brand appears (0 to 1). Rank score is 1 ÷ (1 + 0.1 × (average rank − 1)), so a brand that averages 1st keeps its full detection rate and a brand that averages 2nd keeps about 91% of it. The score is detection rate × rank score × 100. Their worked example: 80% detection at an average rank of 2 gives 72.7.
Trakkr: position points with a square root
Trakkr awards 10 points for position 1, down to 1 point for position 10, and nothing below that or for answers that don't mention you. The raw figure is total points ÷ (successful responses × 10) × 100. The published score is 100 × √(raw ÷ 100). The square root lifts low raw values, so steady mid-list presence scores better than occasional top placements. Trakkr suggests 40+ as good and 60+ as excellent, and notes those bands aren't universal category benchmarks.
LLM Pulse: reciprocal-rank weighting
LLM Pulse defines its AI visibility score as a position-weighted mention rate. Each mention is worth 1 ÷ position (1st = 1.0, 2nd = 0.5, 3rd ≈ 0.33), summed and divided by total evaluations. It reports the unweighted mention rate separately. Its illustrative bands put category leaders at roughly 6–13% weighted, and it labels them "not a universal industry benchmark."
Semrush: a benchmark score without a published formula
Semrush describes AI Visibility as "a benchmark score (0–100) showing how often your brand appears in AI-generated answers compared to competitors." Its knowledge base defines mentions, share of voice, sentiment, average position and cited pages, but the page we read doesn't give the scoring formula. That's common among larger platforms. It isn't a problem as long as you only compare Semrush scores with Semrush scores.
One dataset, three different scores
To see how much the formula matters, we built a simple example and ran it through the three published formulas. The data is hypothetical, but every number below is calculated exactly as each tool documents it.
Imagine 20 category prompts, each run 5 times in one assistant: 100 successful answers. Two brands are tracked:
- Your brand appears in 30 answers: 6 times in 1st place, 8 times 2nd, 8 times 3rd, 5 times 5th and 3 times 8th. Average position 3.17.
- Competitor B appears in 45 answers, but lower down: 10 times 3rd, 15 times 5th and 20 times 7th. Average position 5.44.
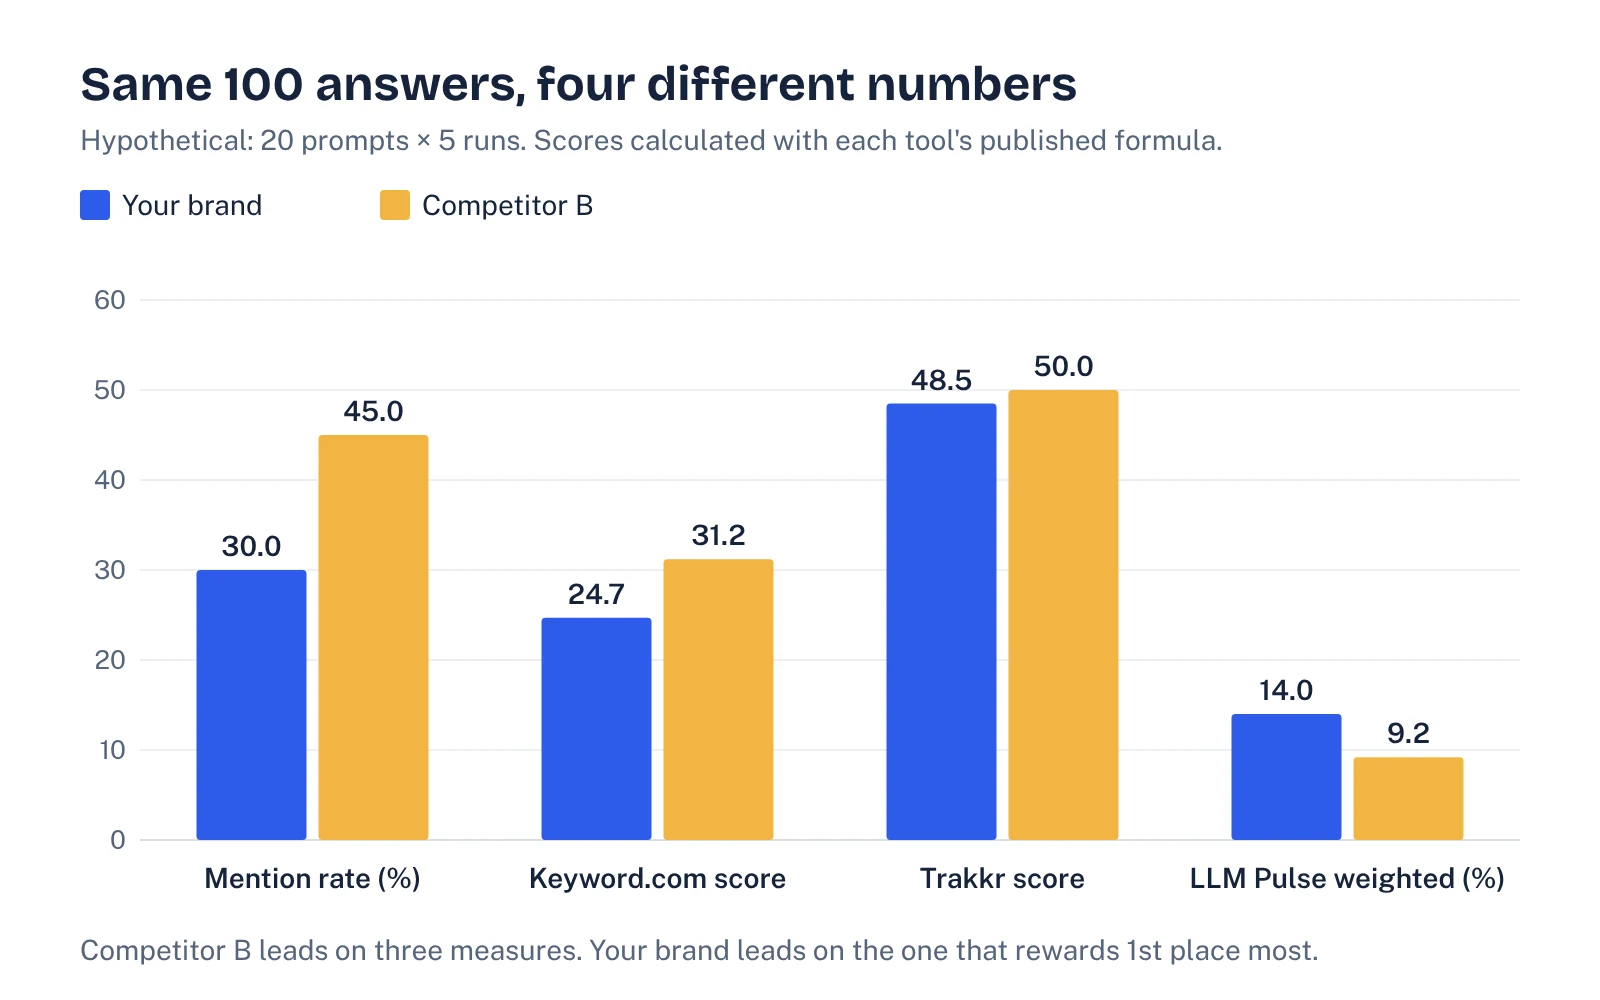
| Measure | Your brand | Competitor B | Who leads |
|---|---|---|---|
| Mention rate | 30.0% | 45.0% | Competitor B |
| Keyword.com visibility score | 24.7 | 31.2 | Competitor B |
| Trakkr visibility score | 48.5 | 50.0 | Competitor B (barely) |
| LLM Pulse weighted score | 14.0% | 9.2% | Your brand |
Three lessons fall out of this:
- The same brand gets very different numbers. Your brand scores 24.7 in one formula and 48.5 in another, from identical answers. A move from one tool to another can look like a 20-point jump that never happened.
- The formula can flip the ranking. Competitor B is named more often, so it wins on mention rate and two of the scores. Your brand is named higher up, so it wins on the formula that weights 1st place most heavily. Neither view is wrong. They answer different questions.
- "Good" depends on the scale. By Trakkr's bands, your 48.5 is "good." By LLM Pulse's illustrative bands, your 14.0% weighted score sits above the category-leader range. By mention rate, you're named in fewer than a third of answers and trail your rival by 15 points. Same brand, three stories.
Sample size matters too. With 100 answers, a 30% mention rate has a 95% margin of error of about ±9 points (1.96 × √(0.3 × 0.7 ÷ 100)), and real-world error is usually wider because answers to the same prompt are related. We walk through that math in our guide to AI share of voice.
What is a good AI visibility score?
There isn't a universal number, and the tools that publish bands say so themselves. A score depends on four things you control or choose: the formula, the prompt set, the models tracked and the competitors included. Change any one and the score moves.
A more useful definition of "good" has three parts:
- Rising against yourself. Same tool, same prompts, same models, measured on a fixed schedule. A steady upward trend over several measurement cycles is meaningful. One week's jump usually isn't.
- Closing the gap to your nearest rival. Your score relative to the two or three competitors buyers actually compare you with tells you more than any absolute number.
- Strong on the prompts that matter. A high average can hide weak spots. Being named for "best [category] for enterprise" matters more than generic definitions if enterprise is where your pipeline is.
See your own AI visibility, free
Get a one-page audit of how ChatGPT, Perplexity and Gemini treat your brand against up to three competitors, plus your biggest gap. In your inbox within 48 hours.
Get my free auditHow to build an AI visibility score you can defend
Whether you use a tool or a spreadsheet, these steps make the number credible to a CFO as well as a marketer.
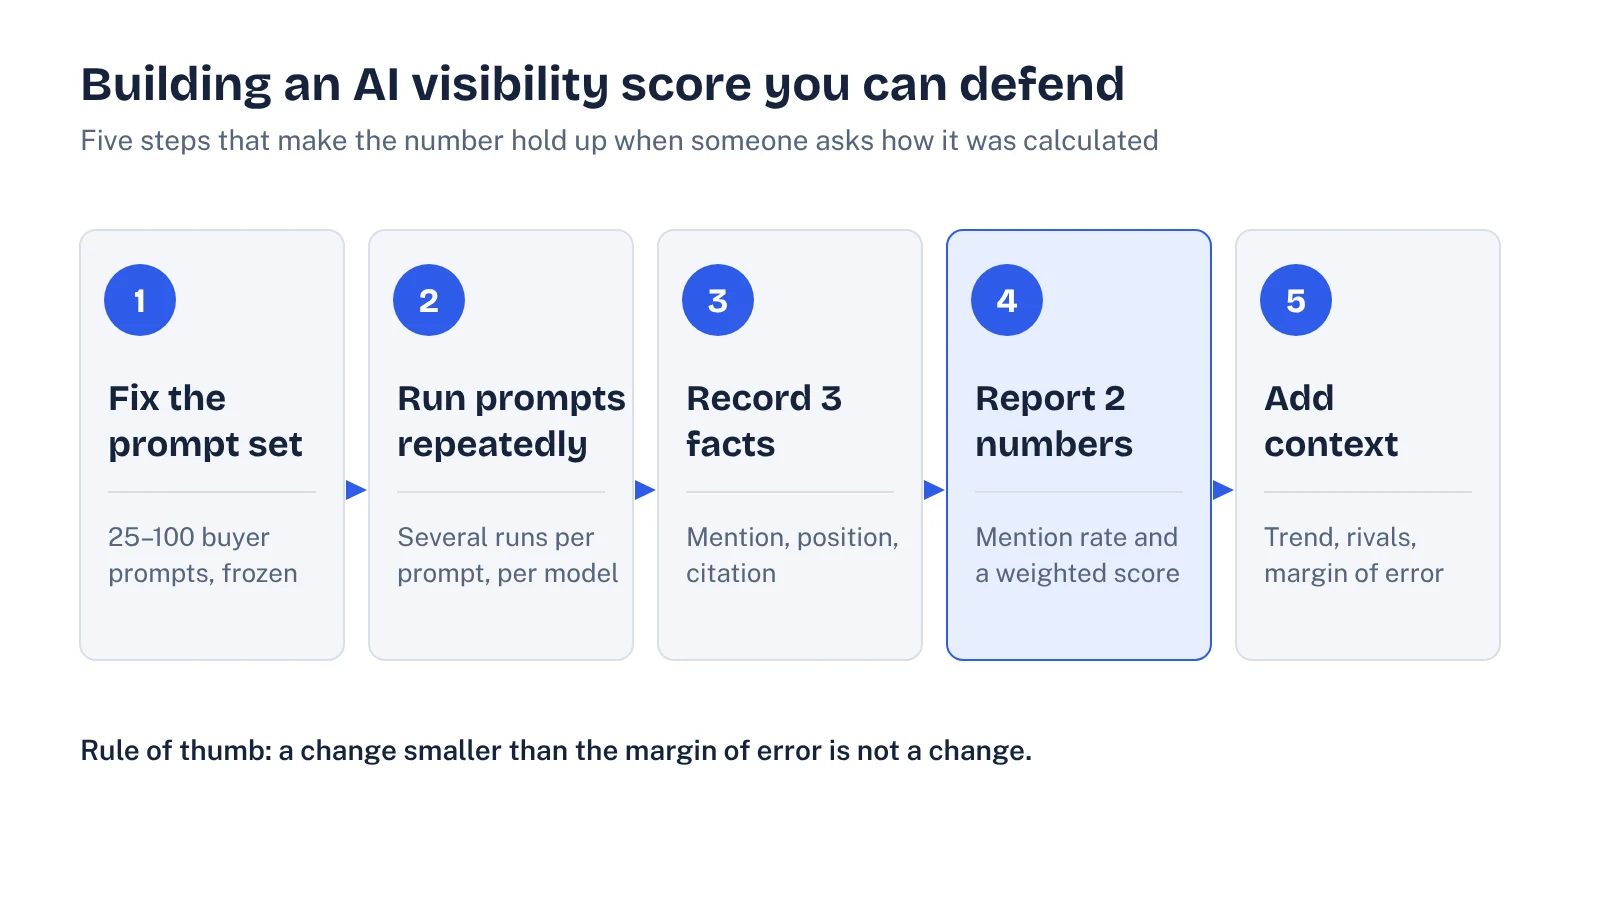
- Fix the prompt set. Write 25–100 prompts that mirror how buyers ask: category, comparison, use-case and "alternatives to" questions. Freeze them. Our AI visibility tracking guide covers how to build one.
- Run each prompt several times. Answers vary run to run, so a single pass is a sample of one. Several runs per prompt per model gives you a rate rather than an anecdote.
- Record three facts per answer. Mentioned or not, position if it's a list, and whether one of your pages is cited. Keep the raw rows so anyone can recalculate.
- Report two numbers, not one. Lead with mention rate (simple and the most stable), then add one position-weighted score. State which formula you used and keep it fixed.
- Add context. Show the trend, your closest competitors measured the same way, and the margin of error. A change smaller than the margin of error is not a change.
If you'd rather not build the pipeline, most tools in our roundup of the best AI visibility tools automate steps 2 and 3. Pick one, learn its formula, and stick with it.
How to improve your score
A score is a readout, not a lever. To move it, change what the assistants find when they answer your buyers' questions:
- Answer category questions plainly on your own site. Clear definitions, use cases, pricing context and comparison pages give assistants extractable facts. See our guide to AI search optimization.
- Earn mentions where AI answers look. Third-party comparisons, reviews and community threads shape which brands get named. Our post on AI brand mentions covers where to focus.
- Fix factual errors. If assistants describe your product wrongly, update the sources they rely on rather than chasing the score.
- Re-measure on the same setup. Only then can you tell whether a change worked.
The bottom line
An AI visibility score is useful as long as you know what's inside it. Ask how it's calculated, how many answers it's based on, and whether the competitors and prompts stayed the same. Report mention rate alongside any composite. And never compare scores across tools: as our example shows, the same answers can read 24.7 or 48.5 depending on the math.
FAQ
What is an AI visibility score?
It's a summary metric that estimates how often and how prominently AI assistants mention your brand for a defined set of prompts. Tools usually show it on a 0 to 100 scale or as a percentage. It's calculated by third-party tools, not published by OpenAI, Google or Perplexity.
How is an AI visibility score calculated?
Most tools run a fixed prompt set through one or more AI models, record whether your brand appears and where it sits in the answer, then combine those into one number. Keyword.com multiplies detection rate by a rank score, Trakkr gives 10 to 1 points for positions 1 to 10 and applies a square root, and LLM Pulse weights each mention by 1 divided by its position. Semrush shows a 0 to 100 benchmark score without publishing the formula.
What is a good AI visibility score?
There's no universal benchmark, because the number depends on the tool's formula, your prompt set, the models tracked and your category. Trakkr suggests 40+ as good and 60+ as excellent for its own score, and says these aren't category benchmarks. A better test is whether you're rising over time and closing the gap to your nearest competitor, measured the same way.
Can I compare AI visibility scores from different tools?
No. In our worked example the same answers produced 24.7 in one formula and 48.5 in another. Only compare scores from the same tool, the same prompt set and the same models.
How do I improve my AI visibility score?
Improve the inputs the assistants draw on: clear, extractable pages that answer category questions, accurate comparison and pricing pages, and mentions on the third-party sites and reviews that AI answers cite. Then re-measure with the same prompt set so you can tell real change from noise.
Sources
- Keyword.com: What is the visibility score in AI visibility?
- Trakkr: How is the visibility score calculated?
- LLM Pulse: AI visibility score, how it's calculated
- Semrush Knowledge Base: AI SEO metrics
- SparkToro: AIs are highly inconsistent when recommending brands or products (January 2026)
- Ahrefs Keywords Explorer (US data pulled 13 October 2026)