Share of search for B2B SaaS: how to calculate it, where it breaks, and how it connects to AI visibility

Share of search is your brand's percentage of all branded searches in your category: searches for you divided by searches for you and your competitors. It is a cheap, monthly signal of how many buyers remember your name. This guide shows how to calculate it for a B2B SaaS brand, a worked CRM example, the pitfalls that skew it, and how it connects to AI visibility.
- Share of search = searches for your brand ÷ searches for all brands in your category × 100. Kantar calls it a proxy for market share.
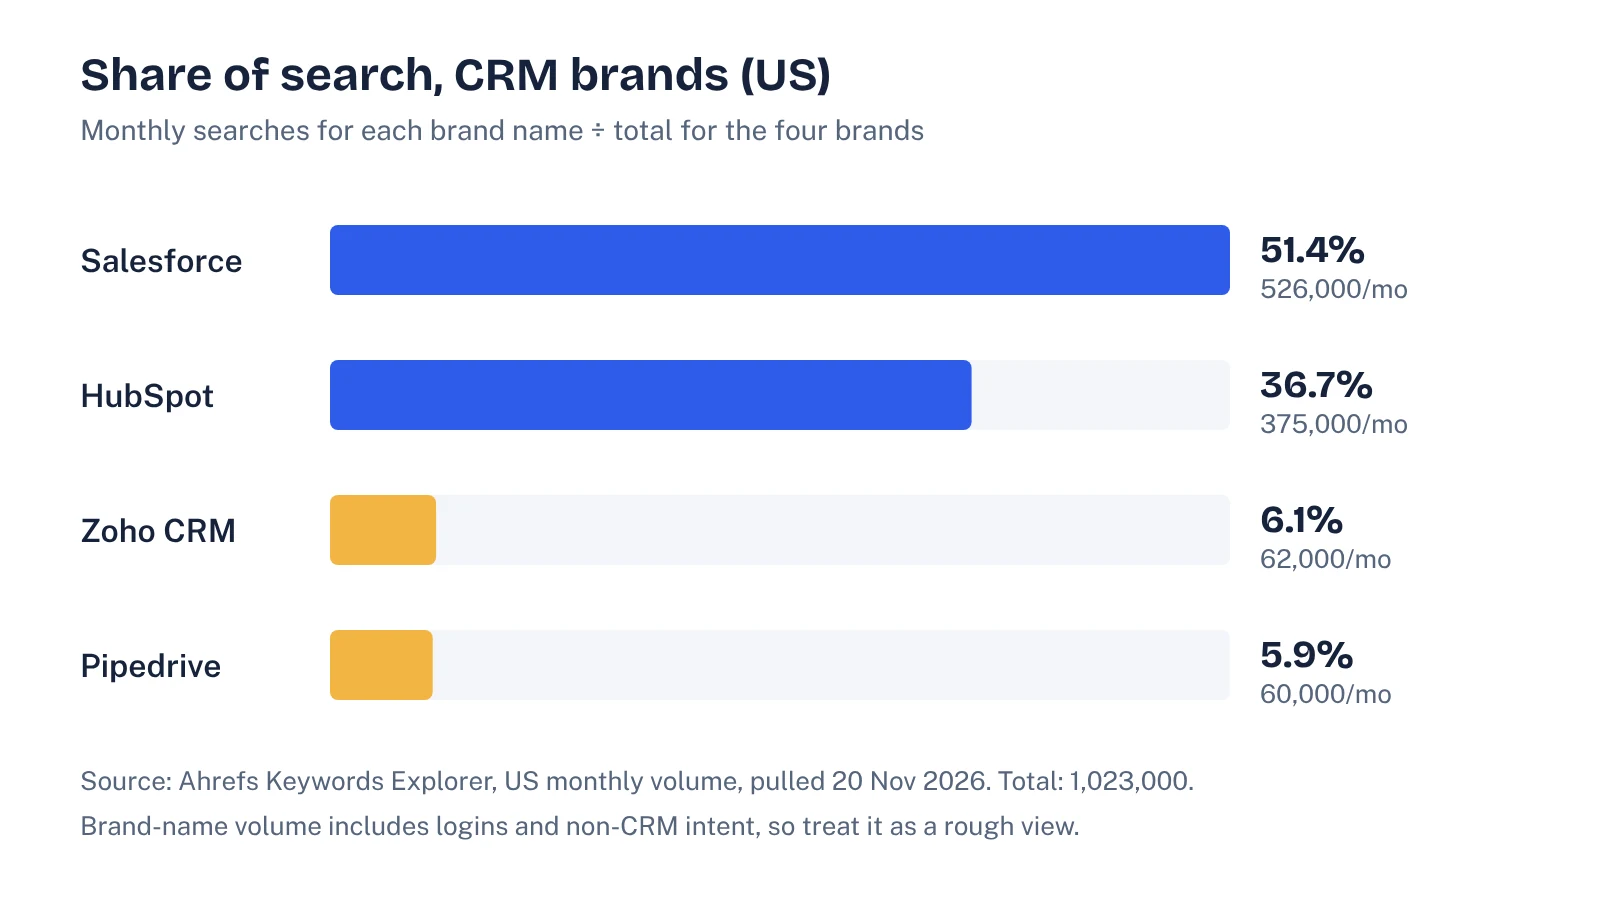
- In our Ahrefs pull for four CRM brands (US, November 2026), Salesforce had 51.4% share of search, HubSpot 36.7%, Zoho CRM 6.1% and Pipedrive 5.9%.
- SaaS brands that are common words, login searches and small categories all distort the number, so lock your keyword set and read trends over quarters.
- Read share of search next to AI share of voice: buyers who get a shortlist from ChatGPT may never search your name, and Ahrefs found branded search volume correlates with AI Overview visibility (0.392).
What share of search is
Share of search is the percentage of all brand searches in a category that are for your brand. If buyers search for four CRM brands a combined 1,000,000 times a month and 60,000 of those searches are for you, your share of search is 6%.
Semrush puts the formula plainly:
The metric got attention in brand marketing after Les Binet, then Group Head of Effectiveness at adam&eveDDB, presented his analysis on the potential for search to predict market share at the IPA's EffWorks Global 2020. Kantar describes it as "a proxy for market share" and says it "correlates with both salience and sales."
Why it is popular: it is cheap, it updates every month, and it reflects choices people make on their own rather than answers they give in a survey. When someone types your brand name into Google, they already know you exist and want something from you.
Share of search vs share of voice
The two get mixed up all the time, and one of the People Also Ask questions on this query is exactly that. The difference is who creates the signal.
- Share of voice is your visibility compared with competitors in a channel: ad impressions, organic rankings, social mentions, or mentions in AI answers. You mostly create it by spending or publishing.
- Share of search is demand. Buyers create it by searching for you by name. It shows whether your visibility is turning into people who remember you.
- Share of market is your share of category revenue or customers. It is the outcome both of the others are supposed to predict.
In practice you want share of voice to lead and share of search to follow. If you have been spending heavily for six months and your share of search has not moved, the spend is not building memory.
| Metric | What it measures | Who creates it | Typical source |
|---|---|---|---|
| Share of voice | Your visibility vs competitors in a channel | You (spend, content, PR) | Ad tools, rank trackers, AI prompt tracking |
| Share of search | Your share of branded search demand | Buyers | Google Trends, keyword tools |
| AI share of voice | How often AI assistants name you vs competitors | Assistants, drawing on the web | A fixed prompt set run monthly |
| Share of market | Your share of revenue or customers | Buyers (purchases) | Finance, analyst reports |
If you already track mentions in ChatGPT, Perplexity and Gemini, our guide to AI share of voice covers how to calculate that side.
How to calculate share of search, step by step
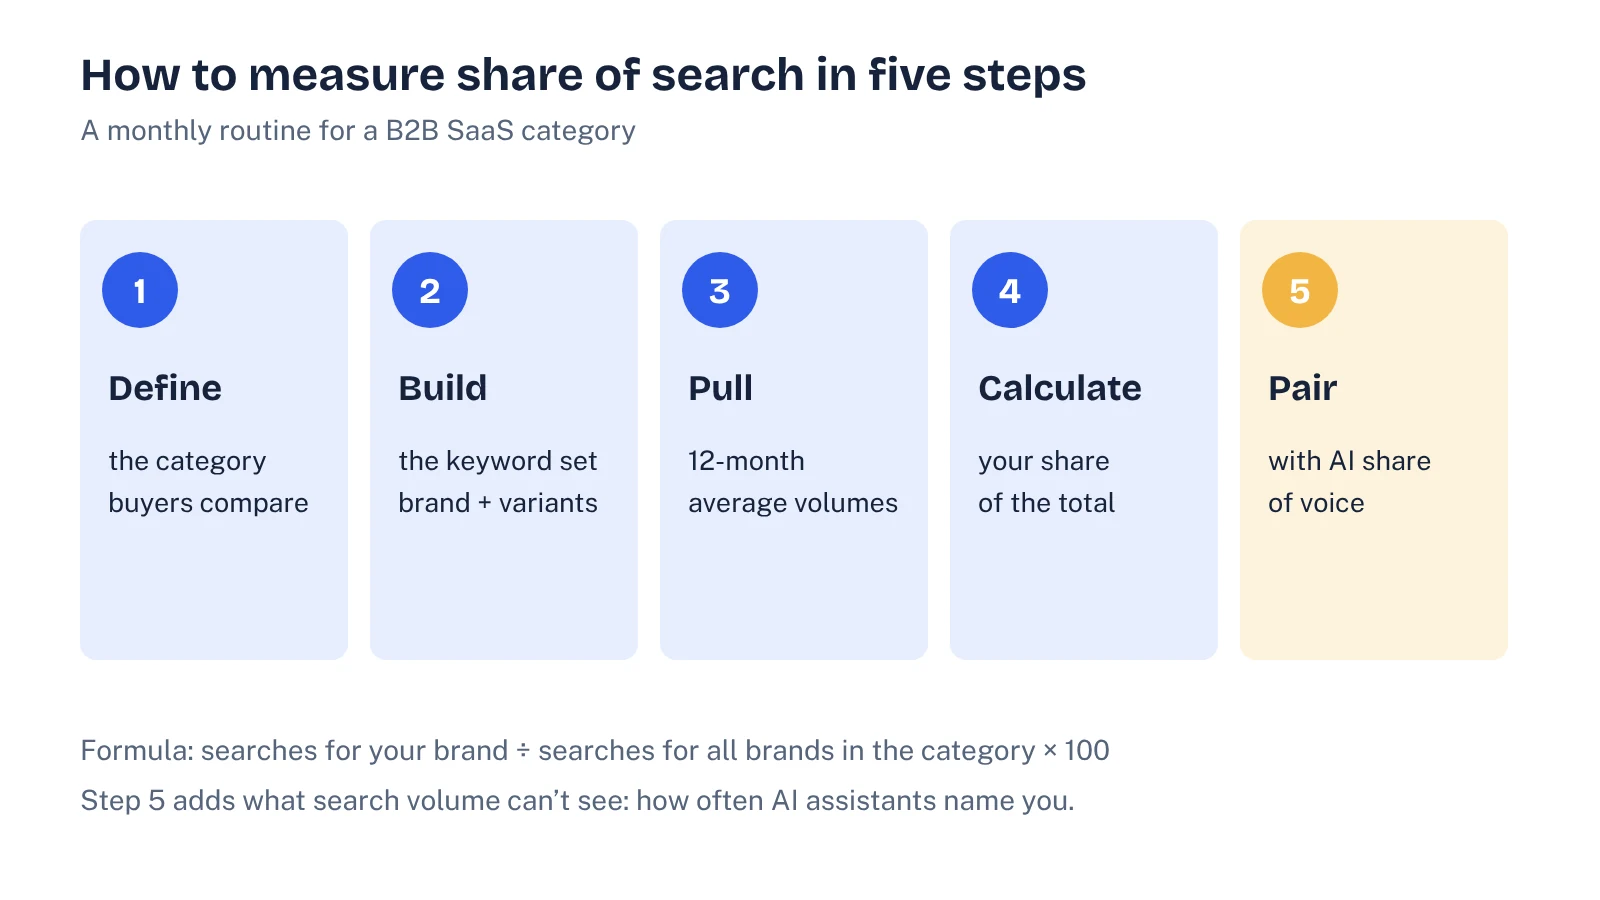
- Define the category the way buyers do. List the five to eight brands a buyer would realistically compare you with. Use your lost-deal notes and the competitors that show up in G2 comparisons, not every company in your market map.
- Build the keyword set. For each brand, include the brand name and the main variants people type: the product name, common misspellings, and "brand + category" (for example "zoho crm"). Leave out navigational noise you cannot separate, and note it.
- Pull volumes. Use 12-month average monthly search volume from a keyword tool, or Google Trends for direction. Semrush notes that Trends values are a 0 to 100 index and "aren't an exact representation" of search volumes, and Kantar points out that Trends only compares five terms at a time.
- Calculate. Divide your total by the category total. Record it in the same sheet every month with the date and the exact keyword list, so the number stays comparable.
- Pair it with AI share of voice. Run the same competitor set through a fixed list of buyer prompts in AI assistants. That shows the part of demand search volume cannot see.
A worked example with real numbers: CRM
To show what this looks like for software, we pulled US monthly search volume for four well-known CRM brands in Ahrefs Keywords Explorer on November 20, 2026.
| Brand keyword | US monthly searches | Share of search |
|---|---|---|
| salesforce | 526,000 | 51.4% |
| hubspot | 375,000 | 36.7% |
| zoho crm | 62,000 | 6.1% |
| pipedrive | 60,000 | 5.9% |
| Total | 1,023,000 | 100% |
Two things stand out. First, the result looks like what you would expect from the market, which is the whole appeal of the metric. Second, the raw numbers are messier than they look. "salesforce" includes job seekers, investors and people looking for the login page. "hubspot" covers its marketing, sales and service products, not only CRM. For a real category analysis you would refine those terms, which is exactly where most share of search numbers go wrong.
Where share of search breaks for B2B SaaS
The top-ranking guides on this topic were written mostly with consumer brands in mind: cars, cameras, sportswear. Software brands have their own problems.
Brand names that are ordinary words
Kantar gives the example of Dodge, a car brand that is also a verb. SaaS is full of these. In the same Ahrefs pull, "asana" showed 263,000 US monthly searches, but Asana is also a yoga term, so an unknown share of that is not about project management. "basecamp" (95,000) has the same problem, and Monday.com gets searched as "monday", which is impossible to separate. If your brand or a competitor's is a common word, use "brand + category" terms or Google Trends topics, and say in your notes that the number is approximate.
Login and support searches
Existing customers search your brand to log in, reset passwords and find docs. That inflates share of search for incumbents with large customer bases and says little about new demand. Strip out "login" and "support" variants where you can, or track them separately as a retention signal.
Small categories and low volume
Many B2B SaaS categories have brands with a few hundred searches a month. Keyword tool volumes at that level are estimates, and a single conference can swing them. Use 12-month averages and look at the trend over quarters, not month to month.
Buyers who never search
This is the newer problem. A buyer who asks ChatGPT for the best tools in your category may get a shortlist, visit two vendor sites directly and never type a brand name into Google. That demand is real, but share of search will not count it.
See your own AI visibility, free
Get a one-page audit of how ChatGPT, Perplexity and Gemini treat your brand against up to three competitors, plus your biggest gap. In your inbox within 48 hours.
Get my free auditShare of search in the AI search era
The link between AI answers and branded search runs both ways, and it is one of the better reasons for B2B SaaS teams to track share of search now.
In Ahrefs' study of 75,000 brands, branded search volume had a 0.392 correlation with how often a brand appeared in Google's AI Overviews. That was higher than Domain Rating (0.326), though below branded web mentions (0.664). It is correlation, not proof that one causes the other, but it suggests the brands people search for by name are also the ones AI features surface.
The other direction matters too. When an assistant recommends you, some buyers go and search your name to check you out. So a rising share of search can be a lagging sign that your AI visibility work is paying off, even when the AI referral traffic itself is small or hard to attribute. Our guide to tracking AI traffic covers the part you can see in analytics.
That is why we suggest reading three numbers together each month:
- AI share of voice: are assistants naming you when buyers ask category questions?
- Share of search: are more buyers looking for you by name?
- Pipeline from branded and direct traffic: is that interest turning into demos?
If AI share of voice rises and share of search follows a quarter or two later, your visibility is building memory. If AI share of voice is flat and share of search is falling, competitors are probably being recommended in conversations you are not part of. A good place to start finding out is our guide to running an AI visibility audit, which includes a free template for logging prompts and competitors.
How to increase share of search
You cannot buy share of search directly. You increase it by giving more of the right people a reason to remember your name.
- Get named where buyers compare. Review sites, "best tools" roundups and comparison pages shape both Google results and AI shortlists. Being named there with a clear description puts your brand in front of people at the moment they are choosing.
- Own one memorable idea. A named framework, report or benchmark gives people something to search for. It also gives assistants something specific to repeat. Our post on brand authority for B2B SaaS covers how to build this over time.
- Keep spending on reach, not only on capture. If all your budget goes to search ads on your own brand name, you are harvesting demand, not creating it. Some share of spend has to reach people who have not heard of you yet.
- Make the brand easy to search. If your product name is a common word, use the same "brand + category" phrase consistently in ads, podcasts and PR so people know what to type.
- Check what AI says about you. If assistants describe your product wrongly, or put you in the wrong category, buyers who hear about you there may never search for you. Fix the sources they draw on first.
A simple monthly tracking sheet
You do not need a dedicated tool to start. One sheet with these columns is enough for most teams:
| Column | What goes in it |
|---|---|
| Month | The month the data covers |
| Brand | You and each competitor in the locked set |
| Keywords | The exact terms summed for that brand |
| Search volume | 12-month average or that month's estimate, same source every time |
| Share of search | Brand volume ÷ category total |
| AI mention rate | Share of your fixed buyer prompts where the brand is named |
| Notes | Launches, campaigns, PR, outages, keyword changes |
Review it quarterly with sales and finance. Share of search is most useful when it is compared with something the business already trusts, like pipeline or win rate, so everyone can see whether it moves first.
FAQ
What does share of search mean?
It is the share of all branded searches in a category that are for your brand. If buyers search for brands in your category a million times a month and 50,000 of those searches are for you, your share of search is 5%.
How do I calculate share of search?
Pick the brands buyers compare you with, list the search terms for each brand, and pull monthly volumes from a keyword tool or Google Trends. Divide your brand's total by the total for all brands and multiply by 100. Keep the keyword list fixed so the number stays comparable month to month.
What is the difference between share of search and share of voice?
Share of voice measures your visibility compared with competitors in a channel, such as ads, rankings or AI answers, and you mostly create it by spending or publishing. Share of search measures demand that buyers create by searching for you by name. Share of voice should lead and share of search should follow.
Is share of search useful for B2B SaaS?
Yes, with care. Software brands that are common words, login searches from existing customers and small categories with low volumes can all skew it. Use brand plus category terms, look at quarterly trends and pair it with AI share of voice and pipeline data.
Sources
- Semrush: What Is Share of Search? & How to Calculate It (June 3, 2025)
- Kantar: Demystifying share of search (August 11, 2025)
- IPA EffWorks Global 2020: Share of search as a predictive measure (Les Binet)
- Ahrefs: AI Overview brand correlation study of 75,000 brands (Louise Linehan, May 2025)
- Ahrefs Keywords Explorer, US monthly search volumes for CRM and project management brand terms, pulled November 20, 2026